

Measurement
Real-time voltage stability indicators
Two indices that recognise long-term voltage instability from local measurements, without needing a full state estimate of the network.
NLI
New LIVES Index
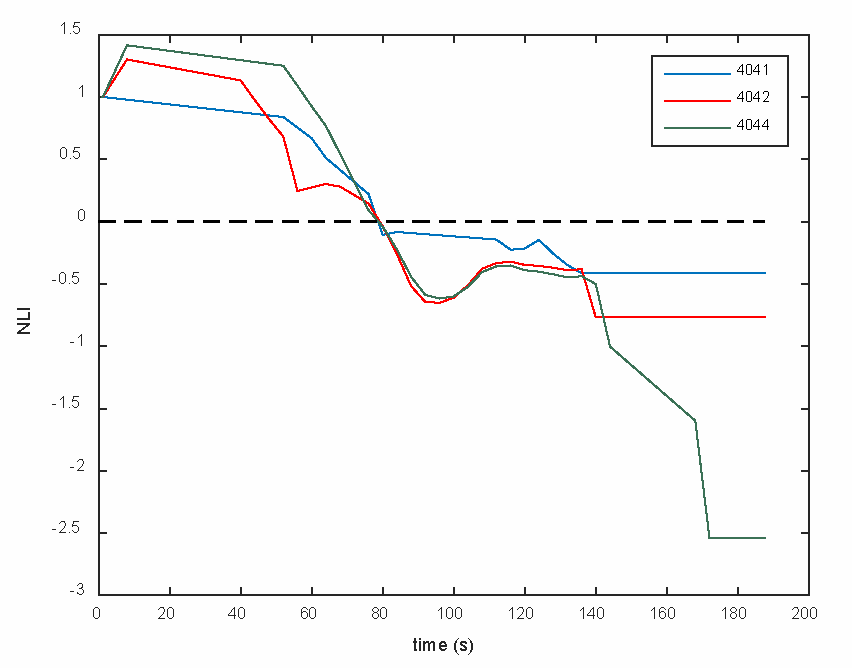
The NLI recognises long-term voltage instability early enough for corrective action, from local voltage and current measurements taken by PMUs at Extra High Voltage transmission buses.
It performs particularly well when placed on the receiving buses of a stressed network corridor feeding a weak area — which is where long-term instability tends to appear first.
- Computed from synchronised phasor measurements
- Requires only a sparse set of PMUs, not full observability
- Crosses zero at the onset of instability
RLI
Relay-based LIVES Index
The RLI can be calculated by the numerical distance relays that already protect transmission lines, using voltage and current measurements taken from instrument transformers at one end of the line.
Numerical relays have sampling capabilities similar to those of PMUs, so the signal sampling and filtering procedure can be common to that of the NLI implementation. In practice this means an operator can gain a stability indicator from protection equipment that is already installed.
- Computed inside existing numerical distance relays
- Single-ended measurement, from instrument transformers
- Shares its sampling and filtering chain with the NLI
Granted patent
GR 1009503 B
Early detection of voltage instability using transmission line protection relays
The method behind the RLI. It computes an instability index inside the numerical distance relays already installed on transmission lines, using only local voltage and current measurements — requiring no additional equipment and no communication infrastructure.
How it works
Watching a collapse arrive
A corridor is loaded a little harder, minute by minute, and its voltage declines slowly. The index falls as the operating point approaches the nose of the curve, the point of maximum loadability with no stable operating point beyond it, and it crosses zero there. In service, warning and alarm thresholds set above zero sound earlier, minutes before the voltage collapses, which is what gives an operator time to act.
Would these indices work on your system?
It depends on your corridors, your PMU placement and your relay estate. Tell us about them and we will give you a straight answer.